Erenna
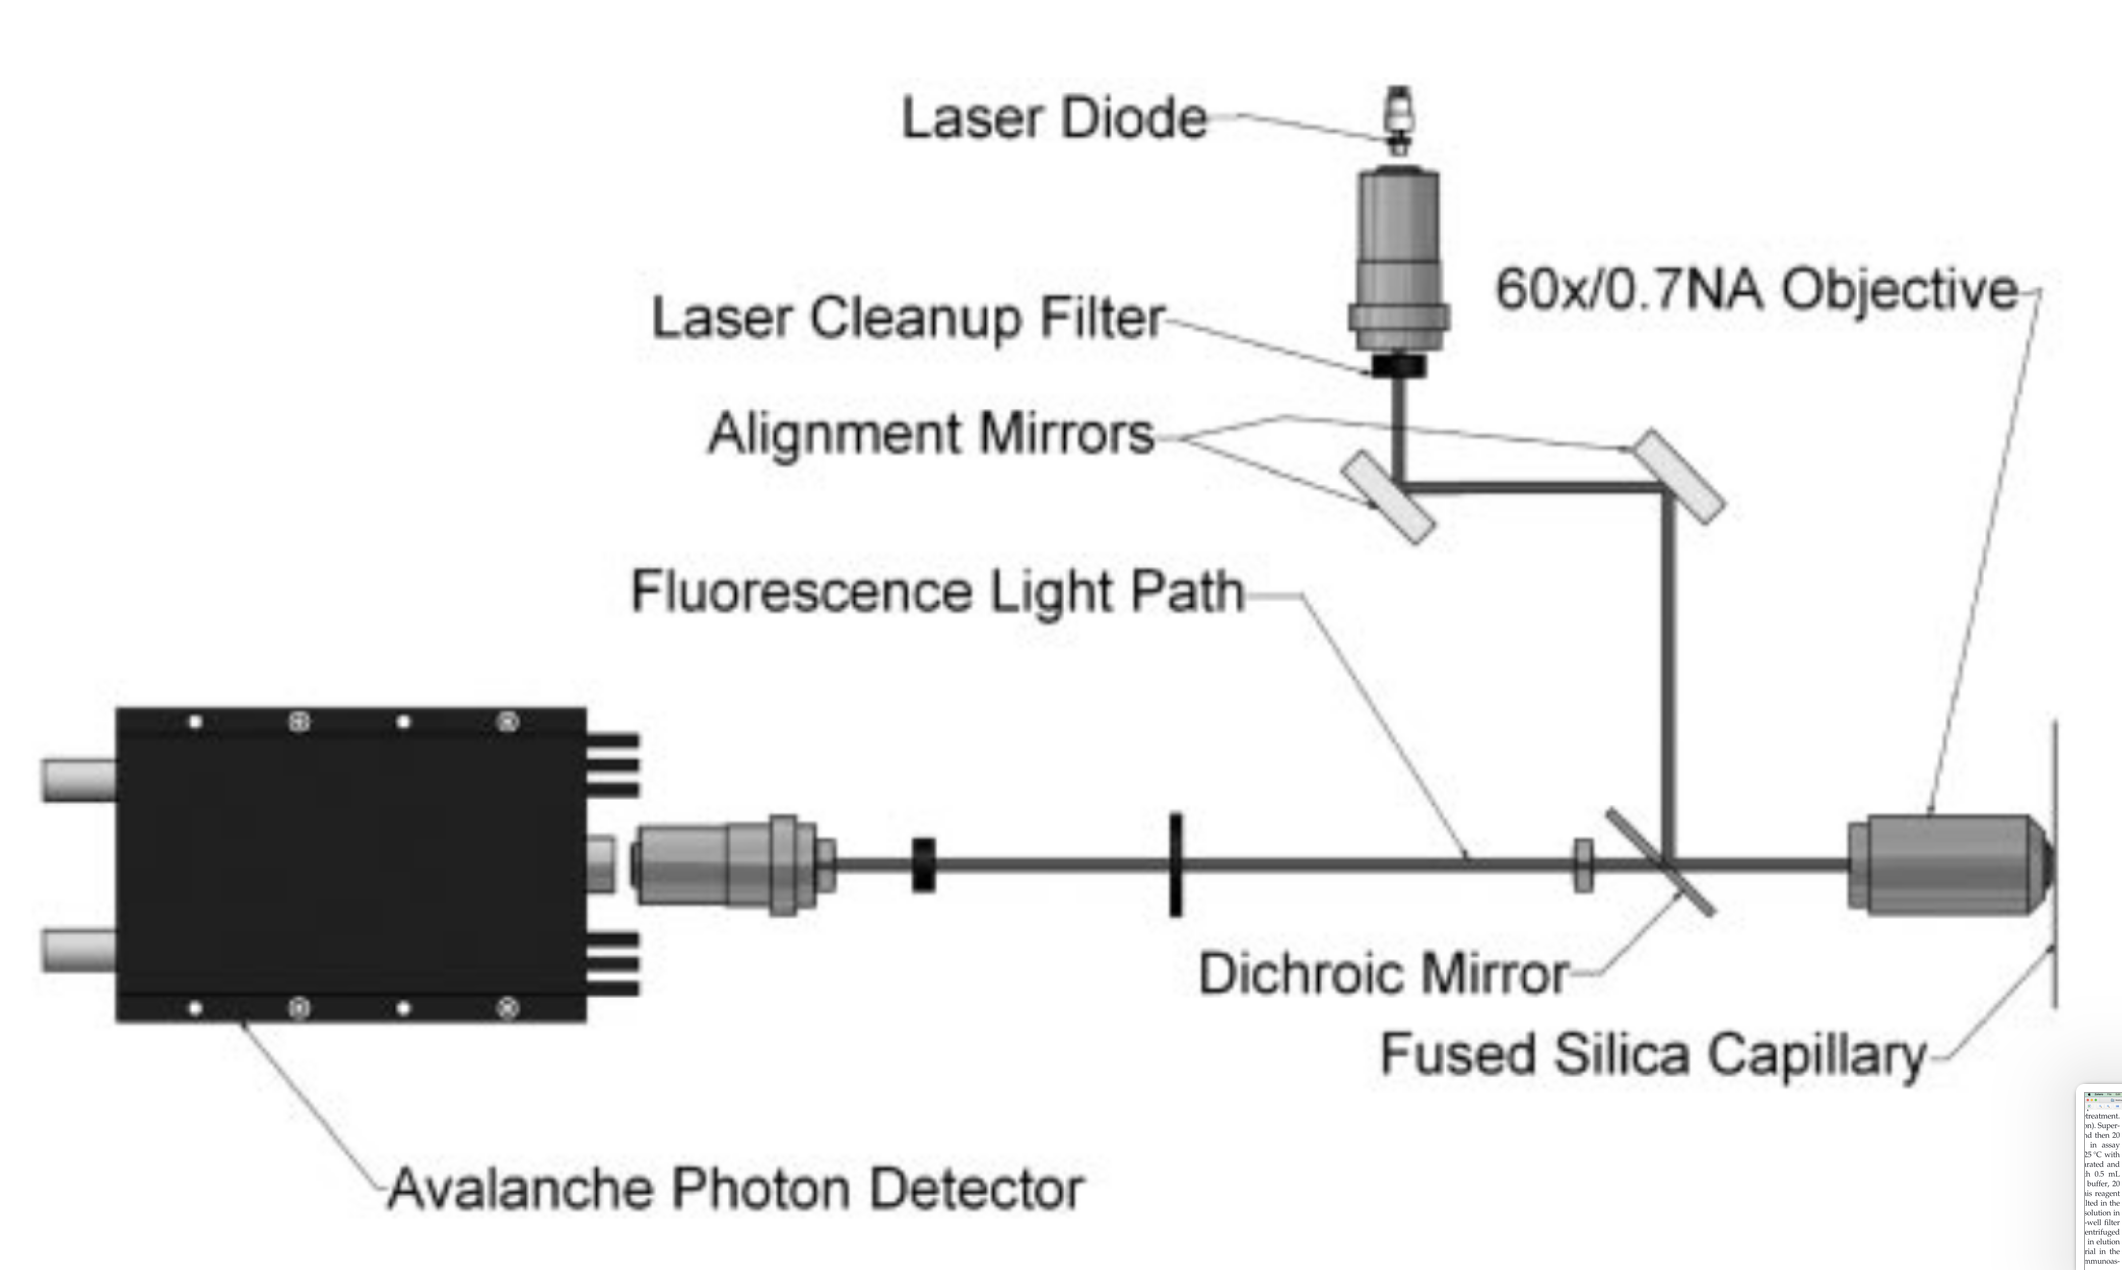
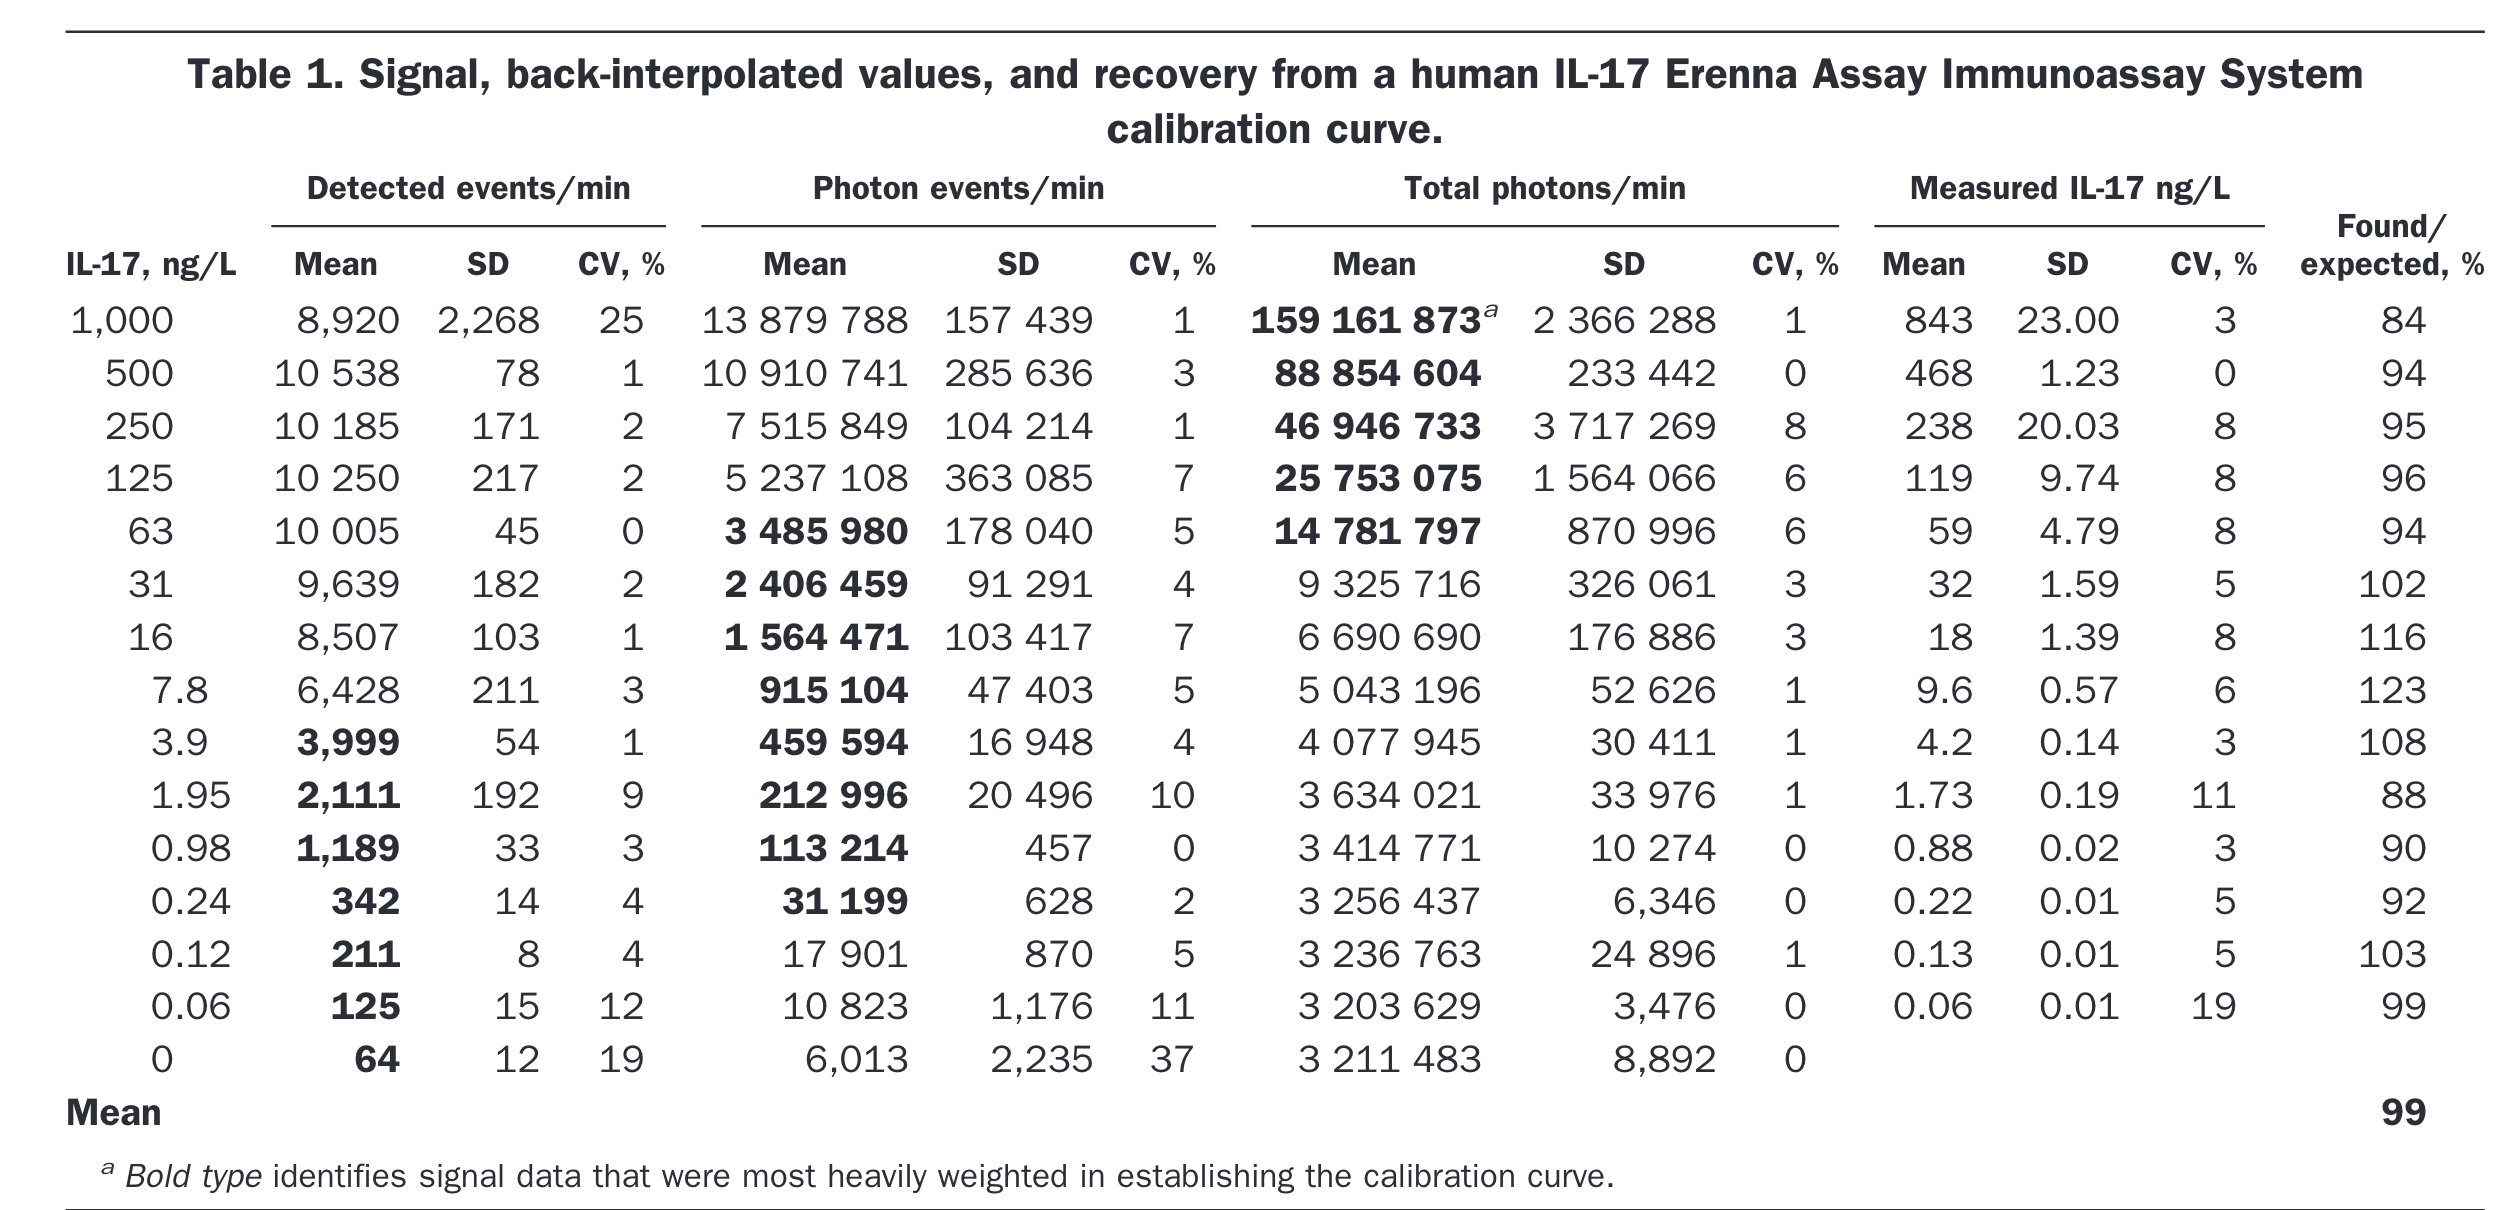
The Erenna Immunoassay System is based on single-molecule counting technology. Liquid is sipped from each well in the 384-well plate and pumped through a 100-μm diameter capillary flow cell. The liquid passes through an interrogation space within the capillary. As depicted in Fig. 11 , light generated from a laser is directed via a dichroic mirror and a confocal microscope lens into the interrogation space. As dye-labeled antibodies pass through this space, they emit fluorescent light, which is measured via the confocal microscope lens and a photon detector. The output from the detector is a train of pulses, with each pulse representing 1 photon that was detected. These pulses are sent to counting electronics, where the pulses are counted in 1-ms bins. The >4.5-log dynamic reporting range is obtained by using a combination of output signals. First the background signal is determined, and based on this value a 5-SD threshold above background is created. Only flashes of light that are greater than this threshold are counted. These individual peaks (not signal intensity) are summed over either a 1-min interval or until 1000 peaks are obtained. The final signal is a sum of all such measured events and is termed detected events (DEs). The 2nd output is termed event photons and is the sum all the photons counted in all the DEs. This measure is used at higher concentrations, for which there is a significant probability that 2 molecules will pass through the detector in the same 1-ms counting bin. At the highest concentrations of analyte, photon events (PEs) begin to saturate and total photons (TPs), the sum of all PEs, is used. DE, PE, and TP signals are used to generate a weighted 4-parameter logistic curve fit for each signal type. To estimate the concentration of an unknown, the DE, PE, and TP signals are interpolated off each of the calibration curves to obtain 3 separate estimates of concentration. These 3 concentrations are combined by use of a weighted mean based on the slopes of the calibration curves. [@todd2007Ultrasensitive Flow-based Immunoassays Using Single-Molecule Counting]
The system uses $100\,\mu\textrm{m}$ capillaries, based on the concentration it would be possible to calculate the flow rate.
I am still puzzled by the total photons/min, since it is fundamentally the same for the blank sample up to $0.24\,ng/L$, however, the number of events is vastly different. It may be there there is some coincidence-type of measurement that allows to overcome the noise of the detector?
This systems looks like a flow cytometer, and is somewhat very similar to what is described in this paper: 202405110829 Cytometer to measure full empty ratio of LNP
Backlinks
These are the other notes that link to this one.
Comment